|

Resources for Members
MESPA Merch Show your part of the our community in style! This year, we're offering six different styles. Plus, you can have your division stitched under the MESPA logo for no additional cost. Order with a colleague for free shipping (orders over $100 ship free). See the Store! |
2025-26 Principal's Calendar This is an essential tool for principals and assistant principals for the 2025-26 school year. This year contains new concrete monthly inspirations to develop relationships, increase belonging among students and improve culture. Members can download a free digital copy. |


.png)

.png)
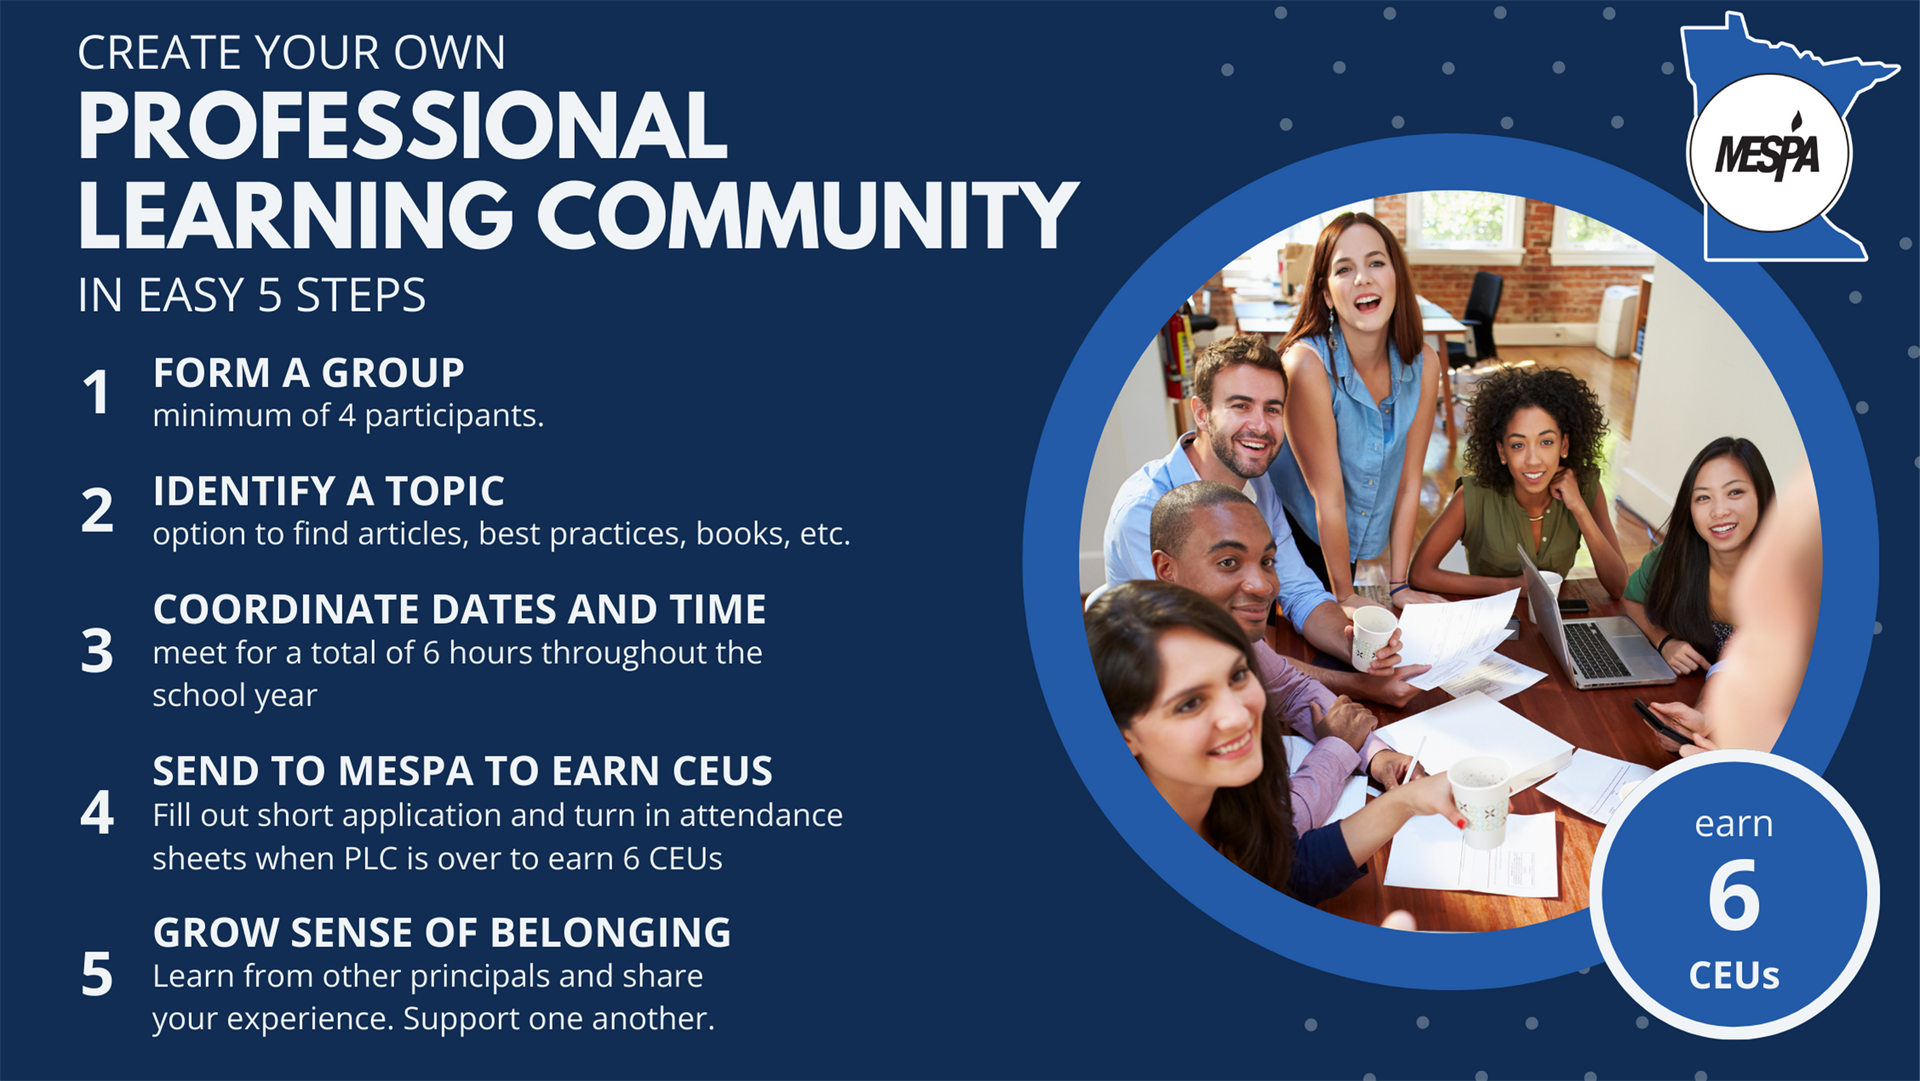
Professional Learning Communities are an invaluable experience to grow professionally and build a sense of community with colleagues. You form a group, identify a topic, coordinate dates and times. If you’d like MESPA to apply for CEUs for you, the group has to meet for a total of 6 hours throughout the course of the year (for example, 4 times for 1.5 hours each). Then, send Christine a brief outline of what you plan to learn and talk about. When your 6 hours are done, send Christine an attendance sheet. This is a great way to earn 6 CEUs while learning about what you care about and building a community of support.
MESPA Business Partners
|
|
|
|


.png)

 |
|  |

|
|
|


.png)
|